

Predictability beats speed.
The Australia Housing Market White Paper 2026 reads the housing market not as a low-demand problem but as a high-friction one. Its planning chapter analyses more than 20,000 consent applications to separate what correlates with delay from what actually predicts it. DDDI Group contributed to the research and the case data behind it.
The country is building below target — and has been for a decade.
The National Housing Accord targets 240,000 completions a year — 1.2 million homes over five years from 1 July 2024. Actual completions in 2023–24 were about 176,000, a shortfall of roughly 64,000. The decade average sits near 192,000. These delivery-gap figures are the Productivity Commission’s, not first-party.
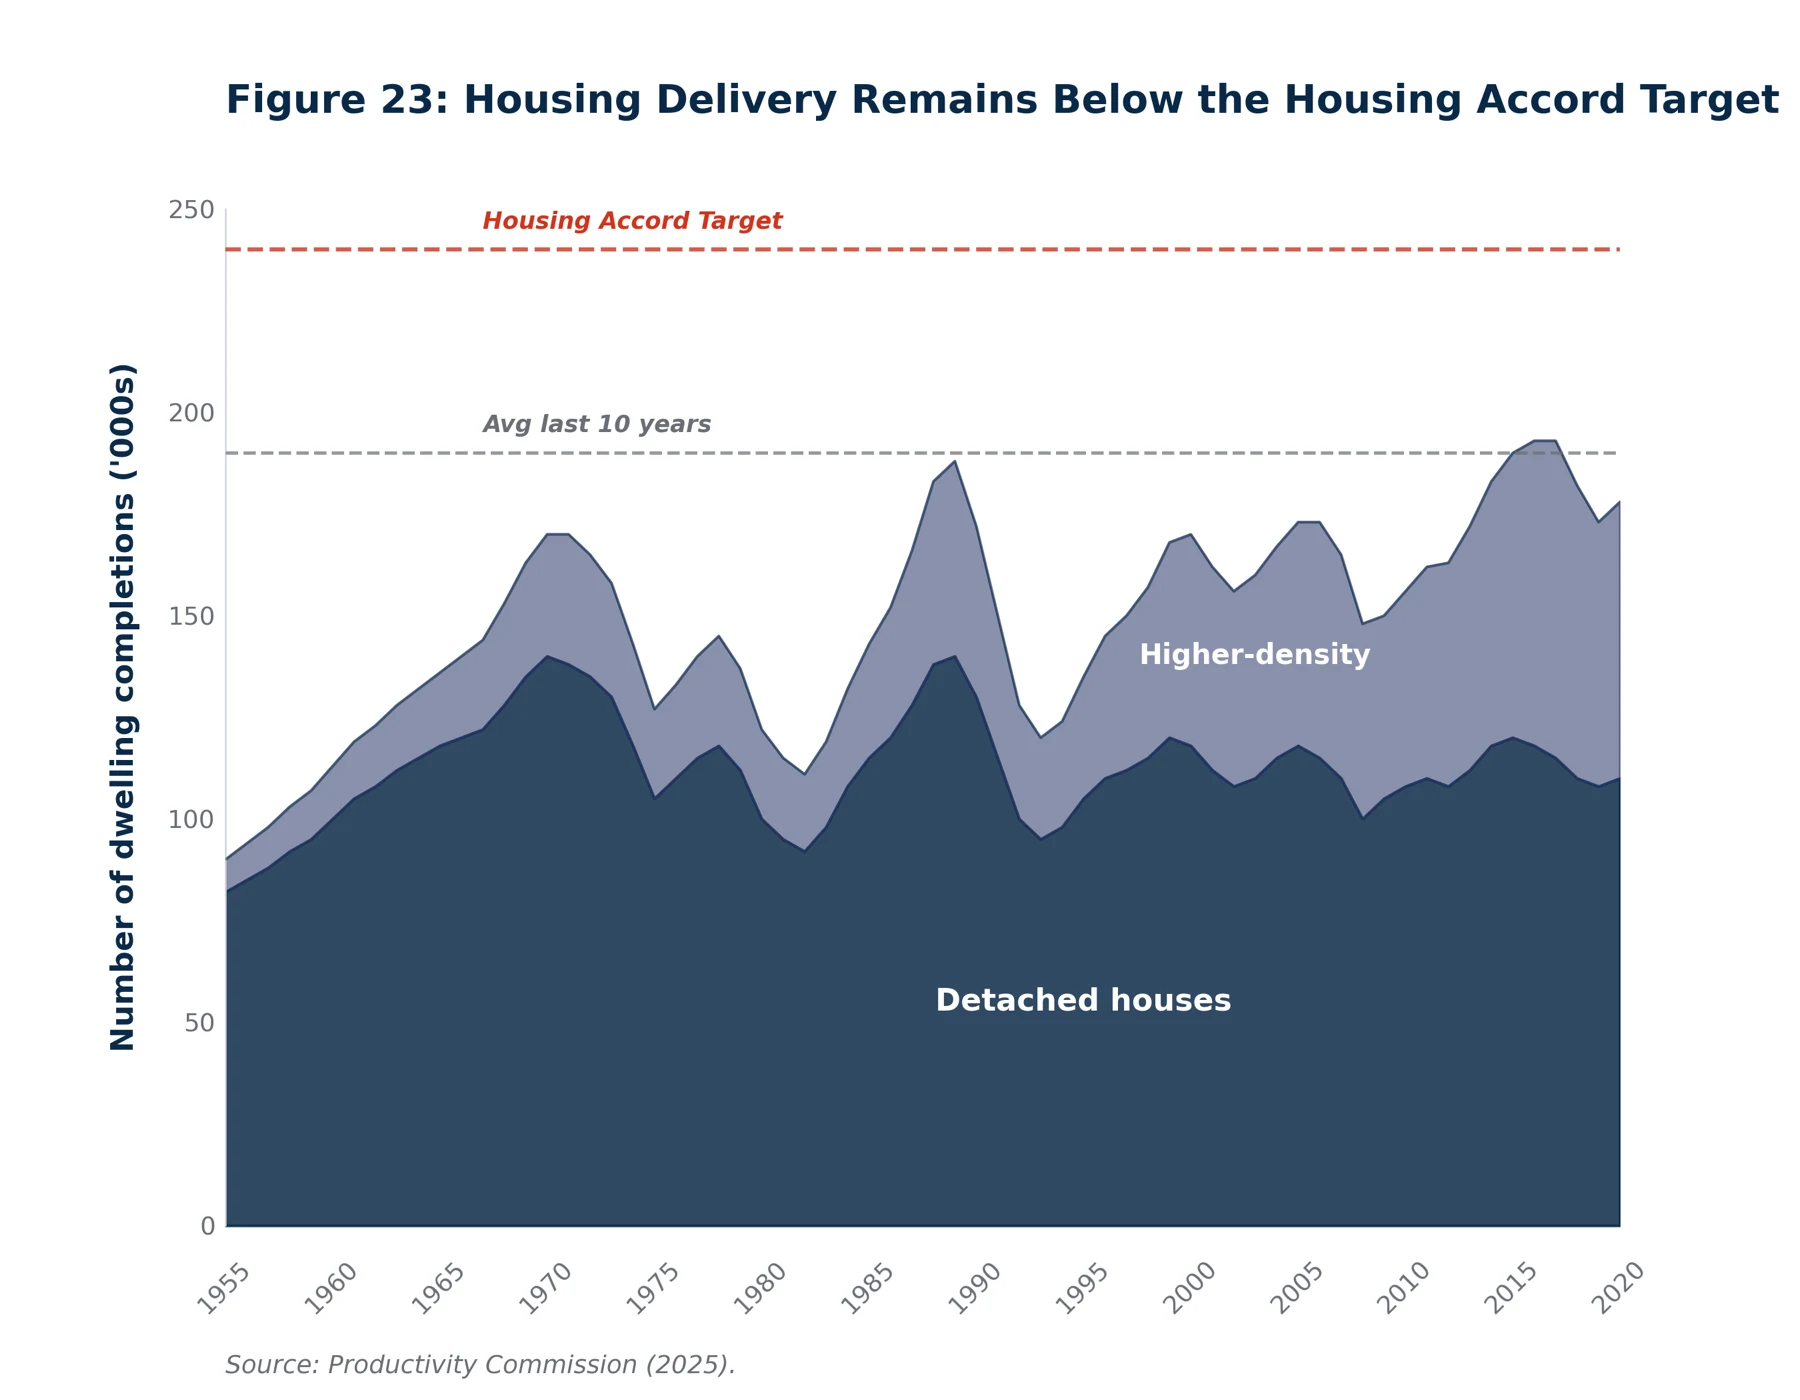
Figure 23 — Housing delivery remains below the Housing Accord target.
Source: Productivity Commission (2025), reproduced from the white paper under CC BY 4.0. The Commission does not endorse any use of its material.
Unlocking the building pipeline.
The planning chapter draws on more than 20,000 residential subdivision consent applications lodged through PlanSA between January 2022 and June 2025, across 18 Adelaide metropolitan councils. Lodgements were proportionally sampled across the councils; the published analysis does not state the sample size.
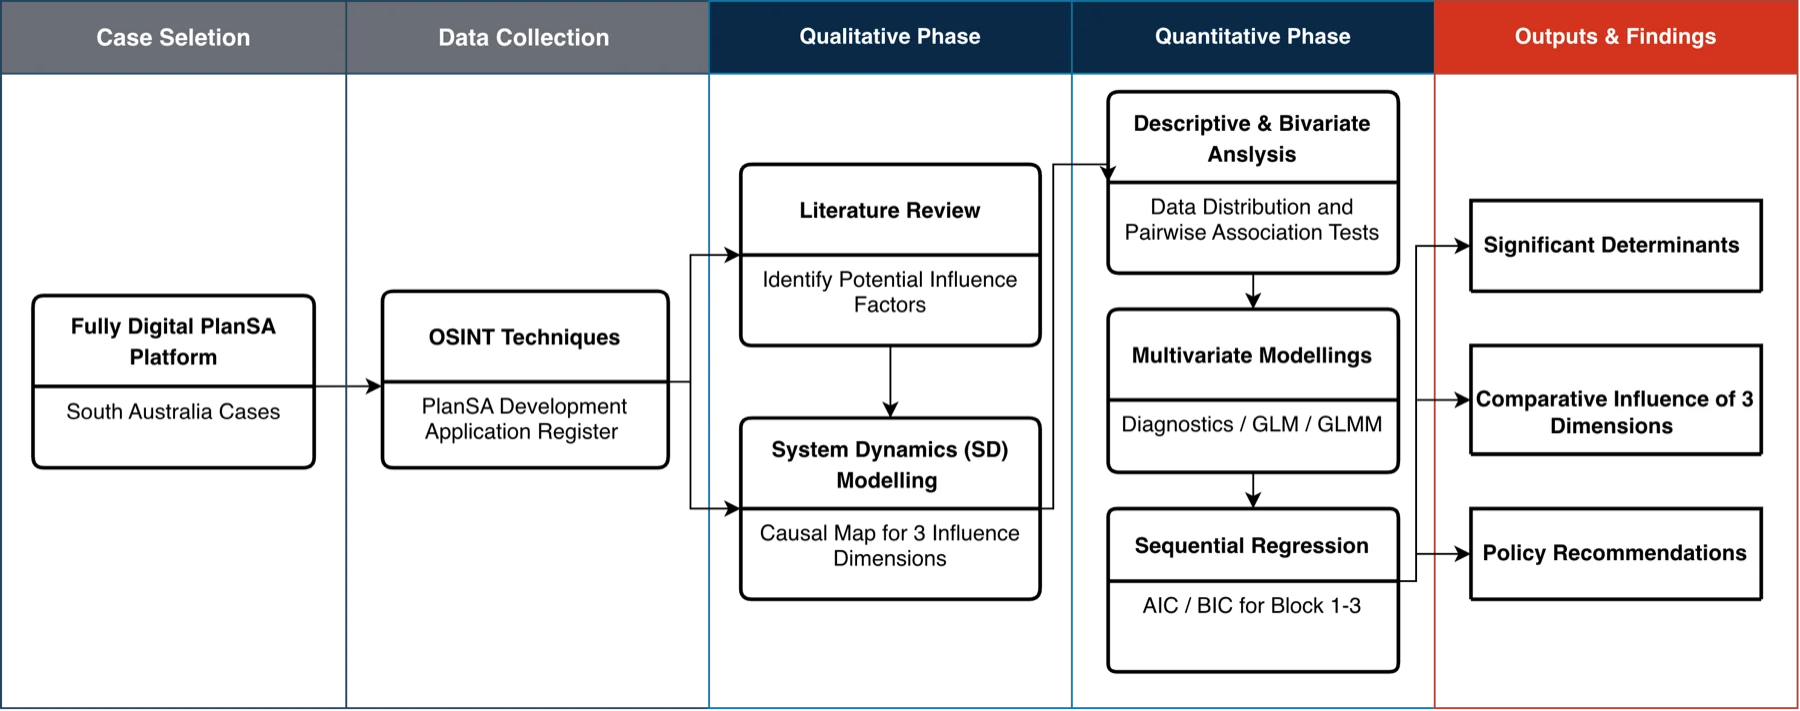
How the analysis separates what correlates with delay from what predicts it — the method behind Chapter 2.
Source: RESI (2026), Australia Housing Market White Paper. Reproduced with permission.
We read the register before anyone draws a plan.
The same OSINT approach behind the white paper reads the development landscape around a site the way an analyst would — every nearby application, ordered nearest-first, compiled automatically from register-scale data before a design dollar is spent. Press play to watch a scan sweep an illustrative suburb.
- Land division
- Multi-dwelling
- Detached
- Other applications
- In assessment
Illustrative pattern — a generated suburb and register, shown to demonstrate the method, not live application data.
Five drivers predict delay. They are all upstream of lodgement.
After multivariate controls, five workflow triggers remain significant — and four intuitive assumptions weaken or reverse. The headline: reforms aimed at workflow triggers are likely to deliver larger gains than reforms focused only on what is being built or where it is built.
Persistent drivers
Assessment pathway
The strongest structural driver — how an application is assessed shapes its timeline more than what is being built.
Verification time
An upstream early-warning signal: delays here foreshadow delays downstream.
Referrals
Each external agency adds a coordination step and a response window.
Public notification
A fixed time cost, plus the risk of iteration.
Subdivision scale
Larger subdivisions carry more to coordinate and more to review.
Assumptions that weaken
Zone & location
Weakens once workflow triggers are controlled for.
Dwelling form
Largely explained by pathway and notification, not form itself.
Tree removal & public holidays
No clear standalone effect survives the controls.
Affordable housing
Reverses — slower unadjusted, but faster in the combined model.
Where the time actually goes.
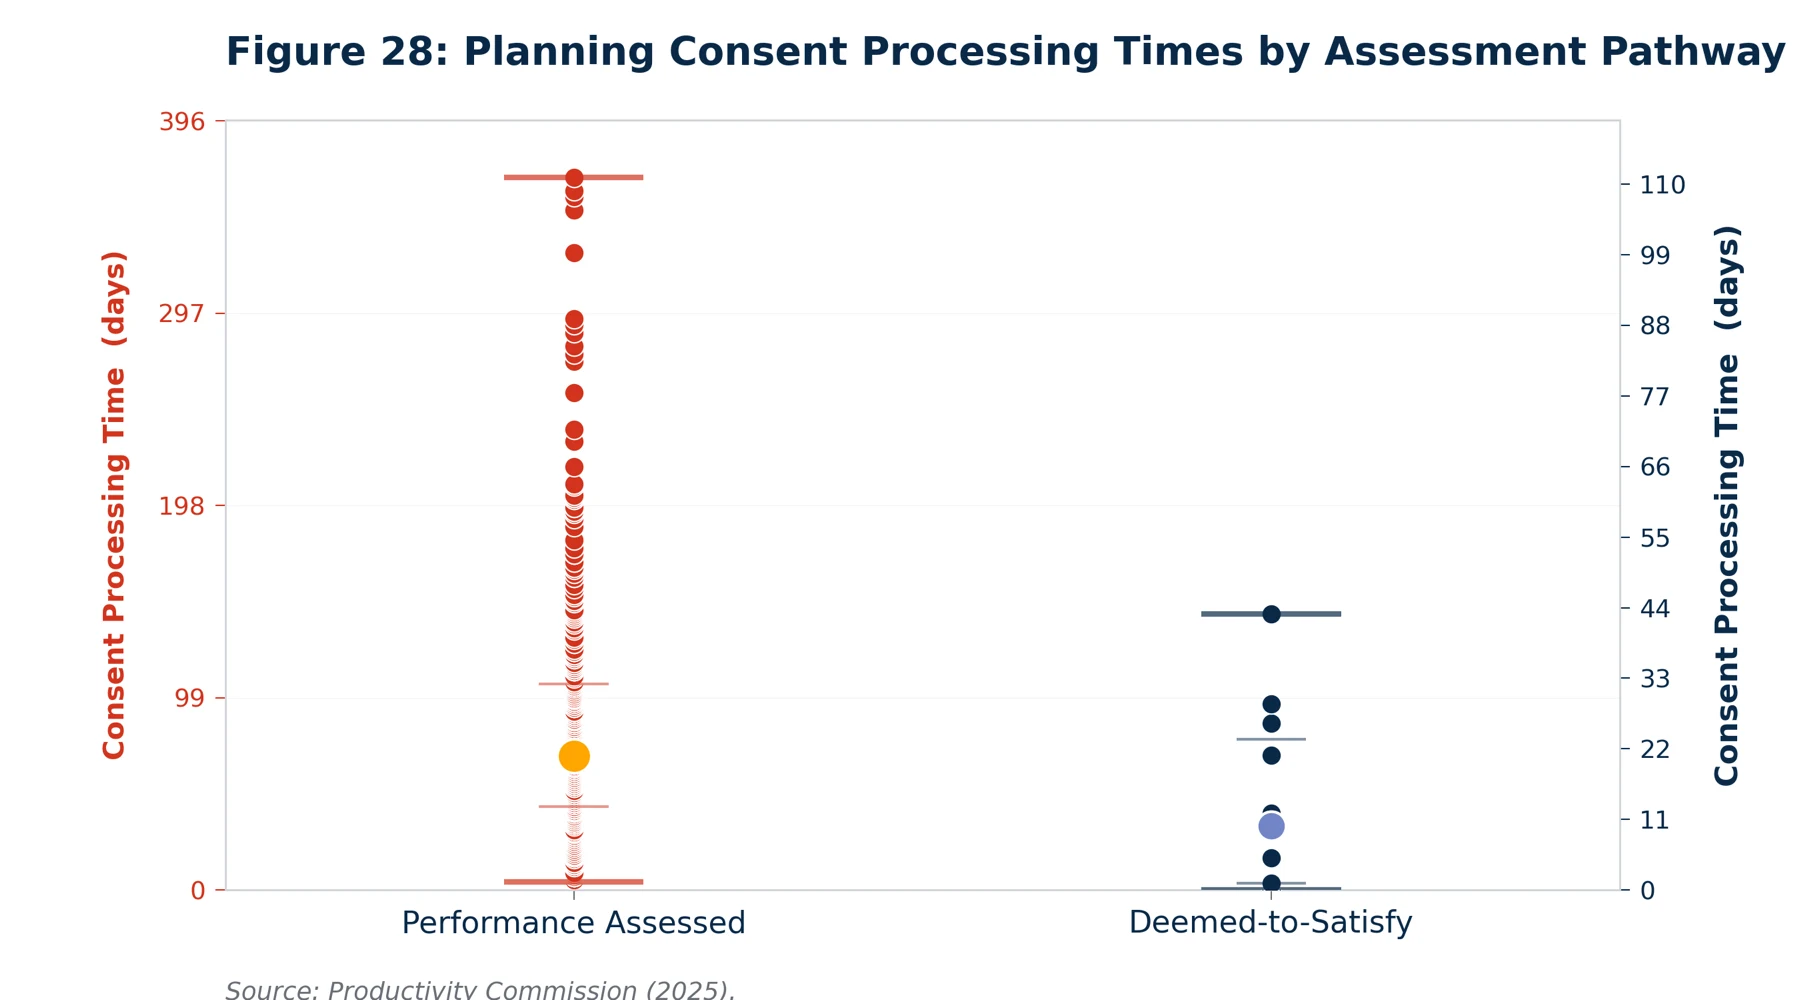
Figure 28 — Consent processing time by assessment pathway. The two pathways are plotted on separate scales.
Source: Productivity Commission (2025), reproduced from the white paper under CC BY 4.0.
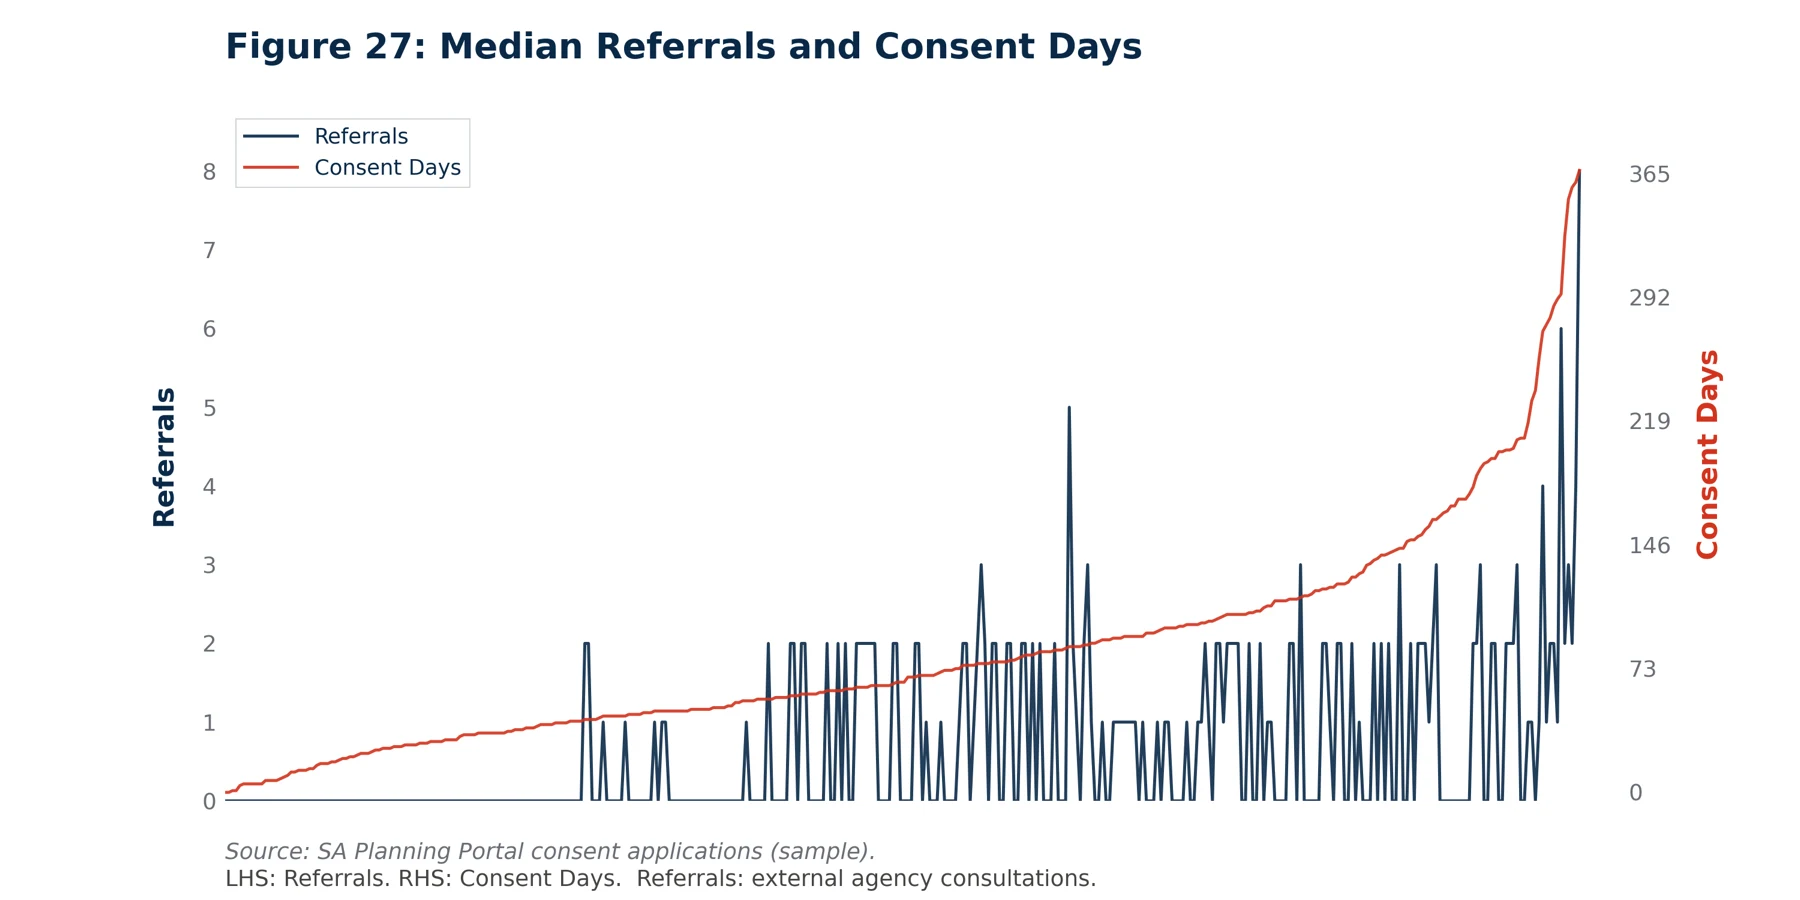
Figure 27 — Median referrals and consent days rise together.
Source: SA Planning Portal (sample), reproduced from the white paper.
“Predictability is worth more than speed. Price the downside, not the median.”
Five practice shifts.
A five-step playbook.
Define scope
Fix the geography, the window and the application type.
Extract records
Pull the consent records from the planning portal.
Tag workflow switches
Mark pathway, notification, referrals and verification for each record.
Run the diagnostics
Bivariate first, then a multivariate model.
Turn results into actions
Convert the significant drivers into practice changes.
Minimum dataset: lodgement and decision dates, pathway category, notification (yes/no), referral count or flag, verification durations (or a proxy), and proposal tags for scale and dwelling form.
A high-friction market, not a low-demand one.
Population near 27.6 million, net overseas migration that peaked around 150,000 a quarter, and new housing loan commitments that peaked near 620,000 in 2021 — yet dwellings under construction fell to roughly 214,000 by late 2024, the lowest since early 2021, against a typical 18-to-36-month delivery cycle. The commercial edge is not scale; it is the ability to control timing, margin and execution.
Financeable demand
Demand that can actually be funded, not headline demand.
Conversion speed
How fast approvals and finance convert into starts.
Margin protection
Holding margin under dispersed, volatile input costs.
Execution governance
Delivering under a higher insolvency-risk environment.
Why the pipeline matters: construction productivity has gone backwards.
The Commission’s inquiry Housing construction productivity: Can we fix it? (released 16 February 2025) sets the context for the pipeline work. Detached homes now take about 10.4 months to complete, up from 6.4 a decade earlier; apartments 27.8, up from 18.5. Actual building is less than half of total project time. The innovation problem, the Commission finds, is substantially a scale problem.
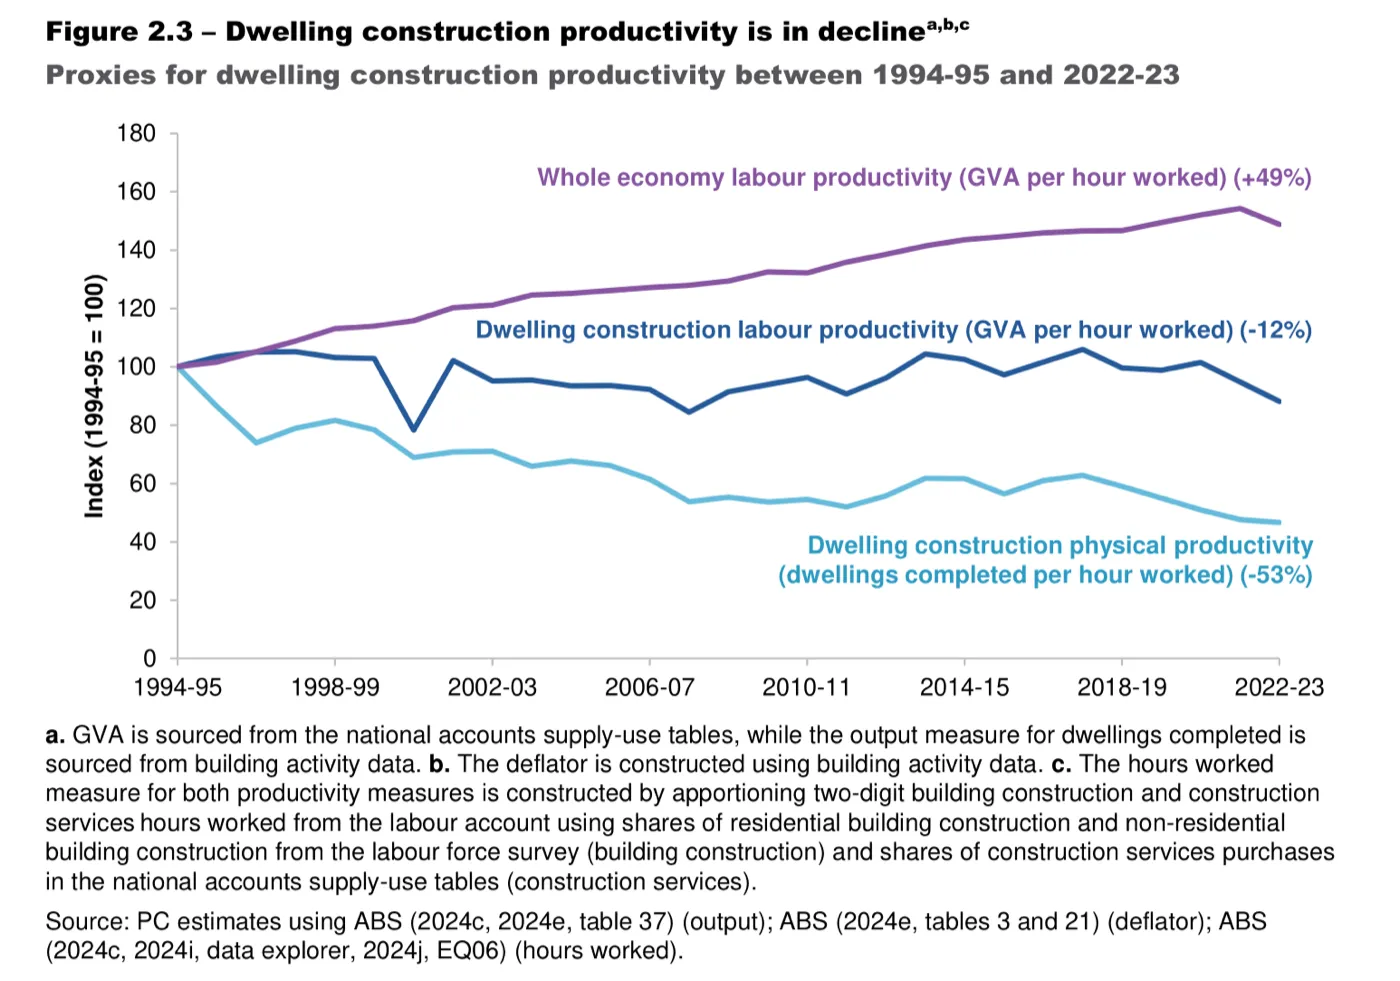
Three decades of divergence in construction productivity.
Productivity Commission (2025), Figure 2.3. CC BY 4.0 — the Commission does not endorse any use of its material.
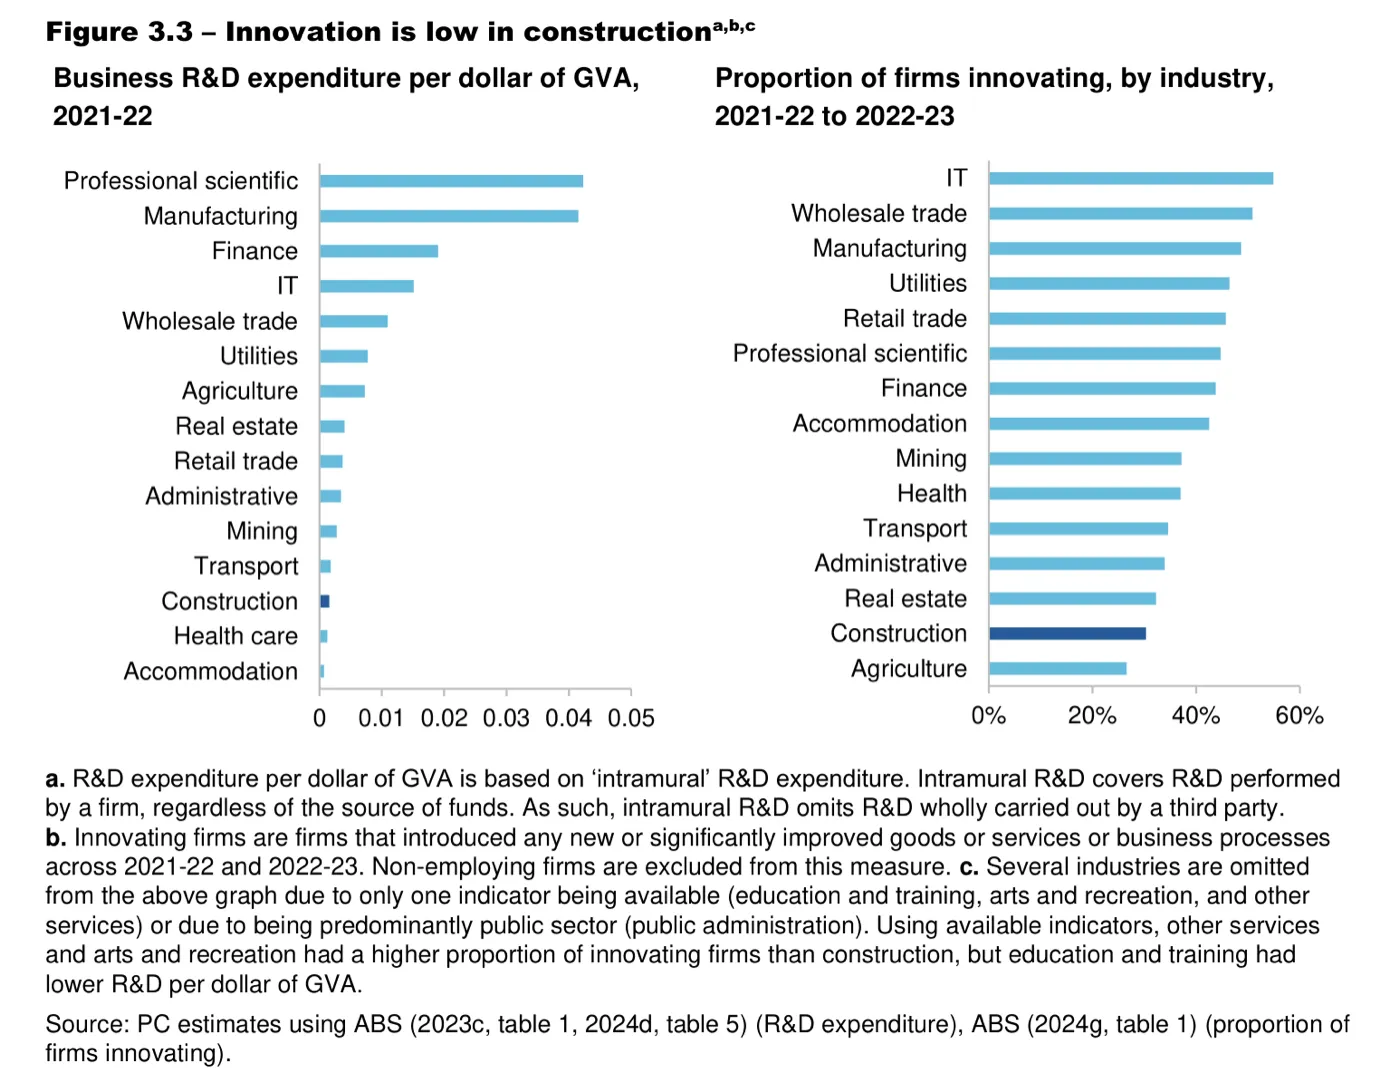
Construction sits near the bottom on both R&D intensity and innovation.
Productivity Commission (2025), Figure 3.3. CC BY 4.0 — the Commission does not endorse any use of its material.
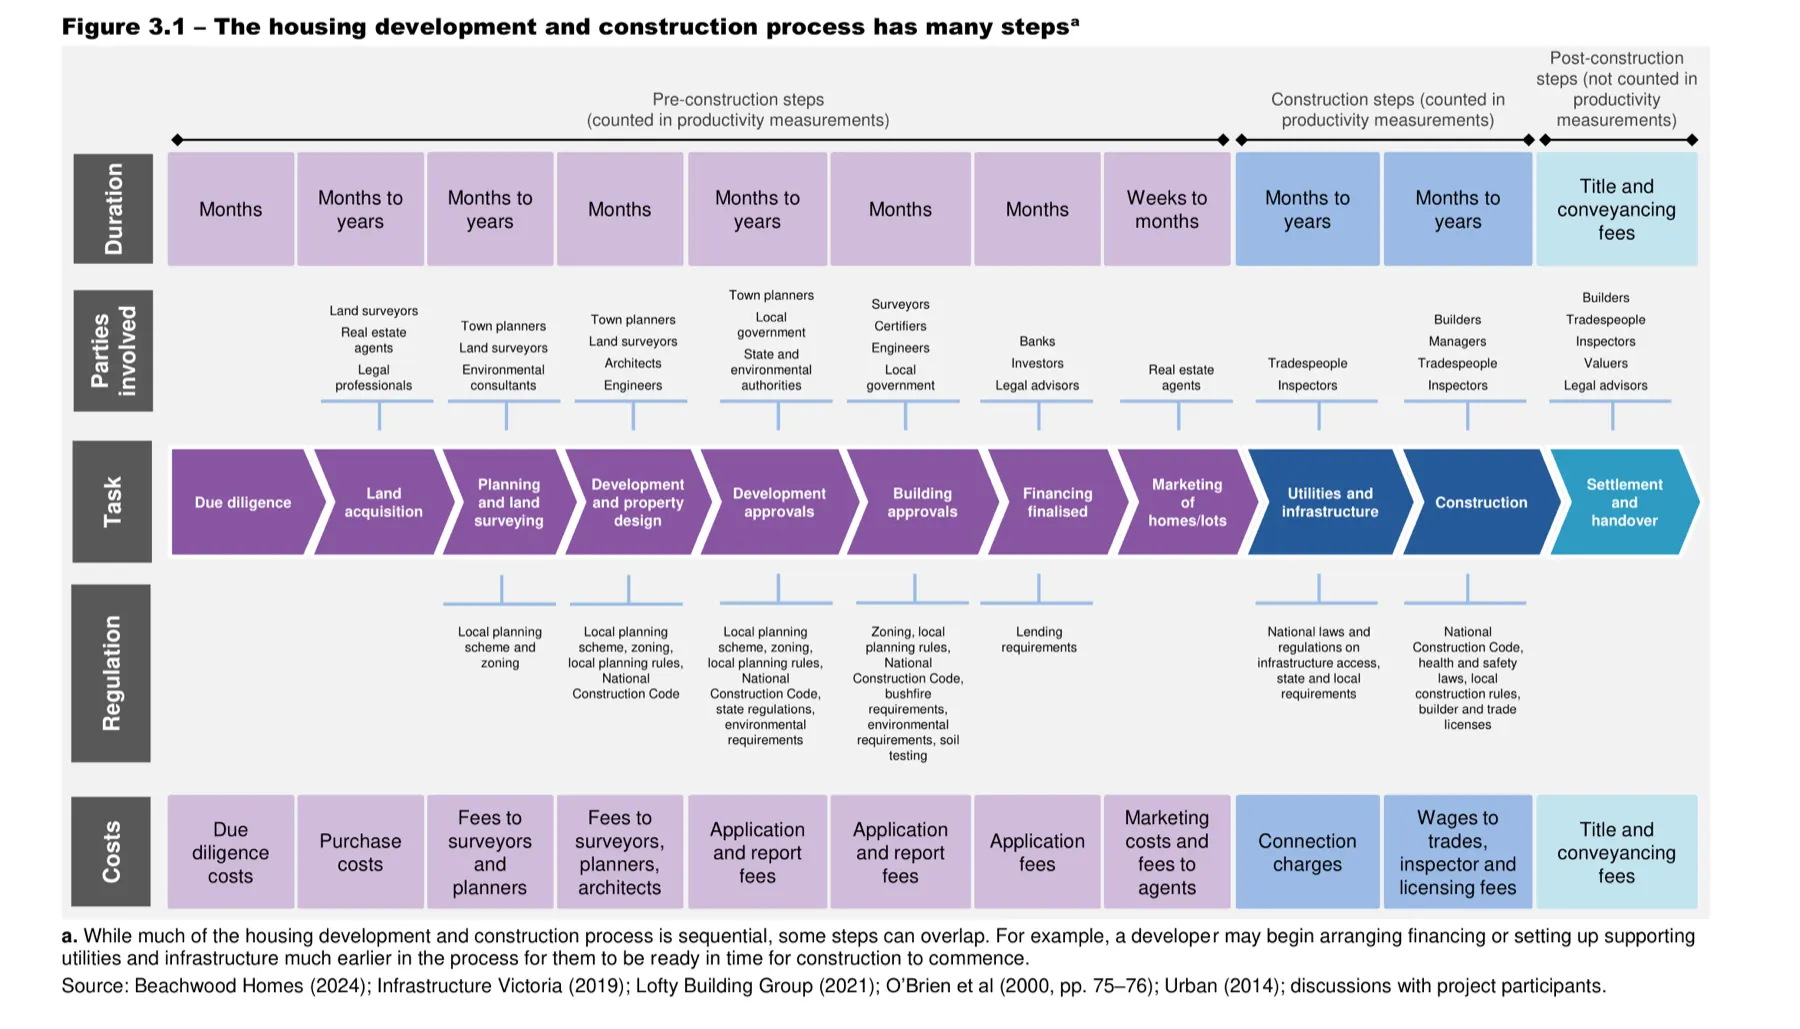
Most of a project’s elapsed time sits before construction begins.
Productivity Commission (2025), Figure 3.1. CC BY 4.0 — the Commission does not endorse any use of its material.
Sources, attribution and access.
Publisher
The white paper is published by RESI, the Australian Residential Construction Institute. DDDI Group participated in the research and contributed case data, and is authorised to reference it here; Chapter 2 is synthesised from the AUBEA 2025 Best Paper study. Analysis of public data to 2025.
Where to read it
RESI publishes the full text in its Knowledge Hub as a four-part In-Depth Analysis Series under Flagship Reports. Full text is available to RESI members; guests see an executive summary.
RESI Flagship Reports →Citation: RESI (2026), Australia Housing Market White Paper. Published by the Australian Residential Construction Institute. Analysis of public data to 2025. Productivity Commission figures reproduced under CC BY 4.0; the Commission does not endorse any use of its material.
Turn approvals into predictable delivery.
The same evidence base powers our applied planning and feasibility work across the group. See how it fits the wider research program — or talk to our team.