
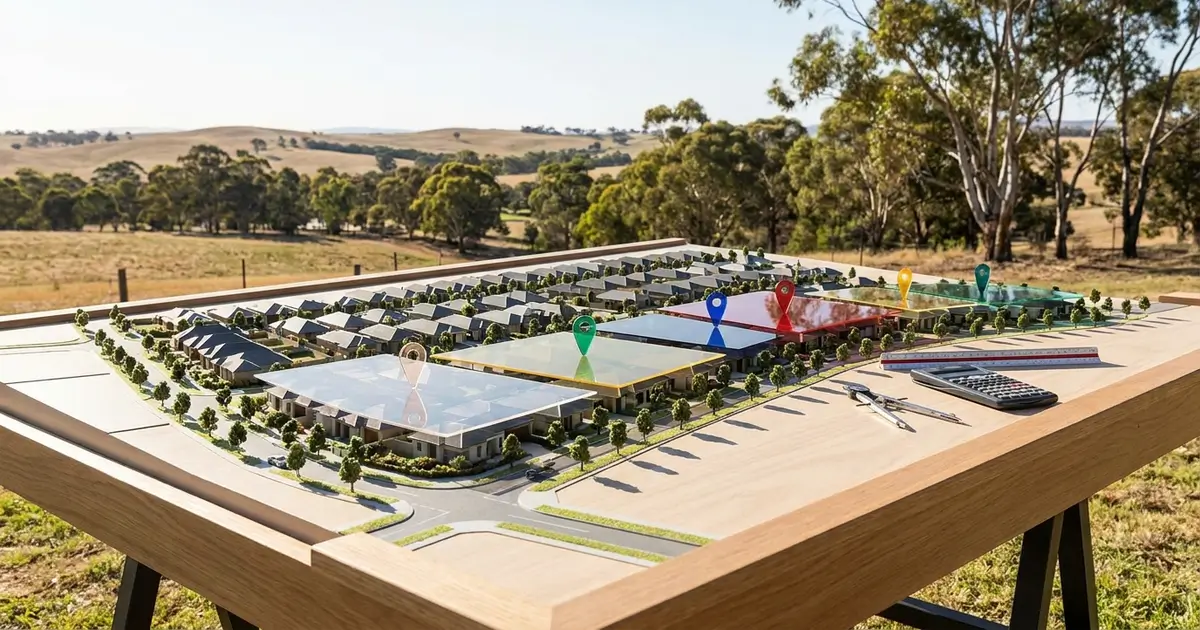
Sensitivity analysis in property development re-runs a feasibility with one assumption moved, to show how much room the project has before the decision changes. Move the sale price, the build cost, the interest rate or the programme, and watch what happens to profit, margin, residual land value and the cash-flow line. Then move several at once.
The boundary matters more than the mechanics. This is scenario testing, not a probability forecast. Moving sale price down 8 per cent shows what an 8 per cent fall would do. It says nothing about whether an 8 per cent fall is likely. Every table below is a chosen input run through arithmetic, and none carries a chance of occurring.
This is the developer-side version, for South Australian landowners, small developers and investors on infill sites. Every number is illustrative, not a real project, and no return is promised or implied.
Key Takeaways
- A sensitivity analysis is a scenario test, not a probability forecast. Moving an input shows what could happen, not what is likely to happen.
- Test variables one at a time before combining them, because each move affects the others. The International Valuation Standards ask for separate sensitivity analyses for each significant factor.
- The residual method is structurally sensitive: a residual subtracts one large uncertain number from another, so uncertainty arrives at the answer magnified rather than diluted.
- Profit is one test. Peak debt is the second. A project can clear the profit test and still fail the funding test.
- Delay rarely looks large on the profit line and looks large on the cash-flow line, because it lengthens the period over which interest and holding costs accumulate.
What Sensitivity Analysis Is, and What It Is Not
A sensitivity analysis starts from a base case, re-runs it with one input changed and everything else held, then reports the movement in the outputs. The value is not the arithmetic, which is a spreadsheet function, but finding out which assumptions can actually change the decision on a site.
The reason a development appraisal needs this at all is structural. The International Valuation Standards asset standard on development property states it as a requirement rather than a suggestion: "The residual value can be highly sensitive to relatively small changes in the forecast cash flows and the practitioner should provide separate sensitivity analyses for each significant factor."
That is IVS 410, section 90.2, published 31 January 2022. Section 90.3 adds that caution is required "because of the sensitivity of the result to changes in many of the inputs, which may not be precisely known on the valuation date, and therefore have to be estimated with the use of assumptions."
Why a residual behaves this way explains everything that follows. A residual subtracts one large uncertain number from another, so uncertainty in either arrives at the answer magnified rather than diluted. Cyberate PM, part of the DDDI Group, puts the mechanism in those terms in its own article on what a feasibility model can and cannot settle. A model can be arithmetically perfect and still produce a figure that moves a long way on inputs nobody thought were contentious.
Now the boundary, because most coverage of this topic blurs it. A sensitivity analysis moves the inputs of a deterministic model and has no probability machinery in it. Attaching a likelihood to any outcome below would require a probability distribution for each input, and that distribution is exactly what a feasibility does not have. The operations research literature states the fork directly: where information on the probability distribution of the relevant factors is mostly lacking, analysts either apply a method that does not require knowledge of that distribution, or invent assumptions about it.
This article uses the first option. No percentage chance is attached to any scenario on this page, and a feasibility reporting "a 30 per cent chance of loss" without a probability model behind it has dressed a scenario up as a forecast.
For the base case this analysis starts from, the pillar on property development feasibility sets out the full process.
The Order Matters: Isolate, Then Combine
Test one variable at a time first. Hold everything else at base, move the variable, read the output. That is what tells you which assumption moves the answer, and it is the only way to rank them. Moving everything at once and reporting one pessimistic number tells you the project is exposed without telling you where.
Once the variables are ranked separately, combine them, because they are correlated in one direction, and mechanically rather than statistically:
- Programme extension raises finance and holding cost at the same time. The facility stays drawn longer while rates, insurance and land tax keep running on a site producing nothing.
- A construction cost overrun raises the drawn balance, which raises the interest on that balance, so a construction overrun quietly contains a finance overrun.
- A sale price fall has no effect on cost at all. It lands purely on revenue, which means it cannot be recovered by managing the build.
That is why the combined scenario below is worse than the sum of the isolated ones. A feasibility reporting only isolated results understates the downside by exactly the amount of the interaction.
IVS 410 section 90.6 lists the basic elements a residual must consider: completed property value, construction costs, consultants fees, marketing costs, timetable, finance costs, development profit and discount rate. That maps almost directly onto the four variables tested here plus the land price, which makes the standard's own register a ready-made test list.
Where to hold the scenarios is a separate question, and the feasibility template in this cluster shows a workbook structure that keeps the base case and each scenario side by side.
The Base Case
Everything below runs off one base case. It is this cluster's shared illustrative example: a small South Australian infill site, three townhouses, all amounts GST-exclusive, all figures invented for illustration. This is not a DDDI project and not a benchmark.
| Base case line item | Amount |
|---|---|
| Gross realisation value (GRV) | $3,000,000 |
| — Construction, including contingency | $1,500,000 |
| — Professional fees | $120,000 |
| — Statutory fees and contributions | $80,000 |
| — Finance and holding costs | $150,000 |
| — Sales and marketing | $150,000 |
| Total non-land development cost | $2,000,000 |
| Target profit | $400,000 |
| Residual land value (RLV) | $600,000 |
Reconciliation on a land price of $600,000: total development cost is $2,000,000 plus $600,000, which is $2,600,000. Profit is $3,000,000 minus $2,600,000, which is $400,000. Margin on cost is $400,000 divided by $2,600,000, which is 15.38 per cent. On revenue the same $400,000 is 13.33 per cent.
Two basis notes. The residual here is written as a subtraction, which is the simplified form: in a real model transfer duty, land-related interest and the GST margin scheme can each depend on the land price, so land price and those costs are interdependent and require iterative solution rather than one subtraction. The residual land value guide works through that circularity. And margin on cost and margin on revenue are different denominators, covered in the margin on cost article.
Scenario 1: Sale Price
What moves is gross realisation. The cost stack does not move at all.
Cyberate PM, a DDDI Group related entity, discloses on its feasibility service page that its model states net profit, margin on cost and "what happens to each when the sale price moves ±8%", paired with 40+ cost line items. That is one firm's disclosed modelling convention, chosen as a round interval. It is not a market forecast, not a forecast range and not an industry standard. Nothing below says the market will move 8 per cent in either direction.
| Scenario | GRV | Profit (land fixed at $600,000) | Margin on cost | New RLV |
|---|---|---|---|---|
| Base case | $3,000,000 | $400,000 | 15.38% | $600,000 |
| Sale price −8% | $2,760,000 | $160,000 | 6.15% | $360,000 |
| Sale price +8% | $3,240,000 | $640,000 | 24.62% | $840,000 |
Read the asymmetry. An 8 per cent fall in sale price removes $240,000 from a $400,000 profit, which is 60 per cent of it. Revenue is the most leveraged line in the model and the one the developer controls least.
The decision this drives is a land price decision, not a build decision. At $2,760,000 of gross realisation the site supports $360,000 of land value on the same target profit, not $600,000. A developer who has agreed $600,000 has agreed a price that only works if the base-case pricing holds.
Scenario 2: Construction Cost
This moves the largest single line in the cost stack. A 10 per cent overrun on $1,500,000 adds $150,000.
| Scenario | Non-land cost | Profit | Margin on cost | New RLV |
|---|---|---|---|---|
| Base case | $2,000,000 | $400,000 | 15.38% | $600,000 |
| Construction +10% | $2,150,000 | $250,000 | 9.09% | $450,000 |
Compare it against the price scenario. A 10 per cent construction overrun costs $150,000; an 8 per cent price fall costs $240,000. Price is the bigger lever per point, but construction cost is the line with a documented recent history of moving, which is why it gets tested even though the percentage looks smaller.
One consistency check. Contingency is a budget line sized to absorb exactly this kind of movement, so a scenario where construction cost rises 10 per cent and contingency sits untouched is internally inconsistent. The movement must consume the contingency before the overrun is real, and once it does there is none left for the next problem. The development cost checklist covers where contingency sits in the stack and who validates it.
What this article will not do is publish an escalation rate. Construction cost movement depends on the cycle, trade mix, design and contract form, and a current figure on a specific design belongs to a quantity surveyor or builder. A rate of thumb here would be worse than no rate.
Scenario 3: Interest Rate
Interest cannot be tested without its assumptions. Assume an average drawn balance of $1,400,000 across an 18-month programme, and a rate rise of 2 percentage points.
$1,400,000 × 0.02 × 1.5 years = $42,000.
| Scenario | Non-land cost | Profit | Margin on cost | New RLV |
|---|---|---|---|---|
| Base case | $2,000,000 | $400,000 | 15.38% | $600,000 |
| Interest rate +2 percentage points | $2,042,000 | $358,000 | 13.55% | $558,000 |
On these assumptions profit falls about 10 per cent. Three caveats belong with that figure.
The calculation is linear and the real thing is not. A rate rise lifts the capitalised interest, which lifts the drawn balance, which lifts the interest again. The linear version is the first-order estimate and understates the effect where interest capitalises. Second, the 2 percentage points is a scenario input chosen to be large enough to see, not a forecast that rates will rise, fall or hold. Third, a rate move does not touch gross realisation or the construction contract. It lands entirely on finance cost, so it competes directly with profit rather than being recoverable from the market, which is what distinguishes it from a construction overrun you can argue about with the builder.
Scenario 4: Programme
Programme risk has a source, and in South Australia that source is published. Development applications under the Planning, Development and Infrastructure Act 2016 run to statutory assessment timeframes, published by PlanSA. For planning consent the published range runs from 5 business days for a deemed-to-satisfy application to 95 business days for a restricted application with public notification, with the intervening figures set by whether a referral or public notification is required. Land division consent runs to 30 or 60 business days depending on the number of allotments and whether a public road is created. The SA development approval timeframes article sets out each pathway with its figure.
Two details turn that range into a risk rather than a number. PlanSA notes a five business day verification period at the start and two business days at the end, and for performance assessed developments the clock can be suspended when the authority or a referral agency requests further information, restarting only when that information arrives. So the statutory figure is a maximum on the assessment and not a prediction of what will happen on your application.
For the illustrative scenario, assume holding cost of about $4,000 a month and average interest of about $6,400 a month, so about $10,400 a month combined. A three-month extension adds about $31,000.
| Scenario | Non-land cost | Profit | Margin on cost | New RLV |
|---|---|---|---|---|
| Base case | $2,000,000 | $400,000 | 15.38% | $600,000 |
| Programme +3 months | $2,031,000 | $369,000 | 14.03% | $569,000 |
On the profit line, three months of delay is the mildest of the four scenarios, costing $31,000 against the $240,000 a price fall costs. Do not conclude it is the smallest risk, because the profit line is not where delay does its damage.
The Cash-Flow Dimension
A feasibility can pass the profit test and fail the funding test. These are two different questions asked of the same project, and a developer who can answer only the first is exposed.
Peak debt is the most a facility is ever drawn at a single point, and on most projects it lands near the end of construction, in the weeks before the first sales settle. It is not total borrowings across the life of the deal and it is not total cost. It is the deepest the project ever sits in the hole, and it is what a lender sizes and prices the facility against. Feasly, a commercial feasibility software publisher, sets out the distinction in its peak debt and funding exposure guide.
Now read each scenario against that line rather than only against profit:
- Construction cost and interest rate raise the peak. Both add to the drawn balance before any revenue arrives.
- Sale price does not raise the peak. It reduces the repayment leg, so the facility must still be funded to the same depth and then repaid from less.
- Programme extension raises the peak and delays when it comes down. That is the worst combination available, and why a three-month delay that looks mild on the profit line can be the binding constraint on the project.
One modelling requirement follows. Model monthly, not annually. A 30-month programme can put its peak inside a single financial year, and an annual roll-up averages that peak away. Popurise, another commercial feasibility publisher, makes the point in its cash flow guide: lenders test against the monthly peak, not the annual rollup. Treat that as a statement about how to build the model, not as a claim about what any particular lender does.
There is a regulatory reason to expect the lender to run its own version of this exercise. APRA's Prudential Practice Guide APG 220 Credit Risk Management, current from 1 January 2022, sets out what a prudent institution does under Prudential Standard APS 220. At paragraph 75 it states that an authorised deposit-taking institution "must undertake regular portfolio level and risk specific stress testing of its credit exposures", and that a prudent institution would use those stress tests to assess risk appetite and strategic decisions "under potential stressed conditions".
The guide goes further. It notes that stress tests might identify vulnerabilities "that would prompt an ADI to tighten its loan origination criteria or lower its risk appetite limits on particular products". That is the mechanism by which someone else's stress test becomes your problem.
The consequence is not that a lender will adopt your numbers. It is that the sensitivity analysis you run is a preview of a test the lender is required to run on its own book, with its own assumptions, and the output of that test can change the terms available to you. Running the scenarios yourself is how you find out before the lender does.
The practical test before accepting a profit result is to read the lowest point on the cumulative cash-flow line and ask whether the facility covers it with headroom. If it does not, the profit number is not the constraint that matters.
Combined Downside and Break-Even
The combined scenario is built from the isolated ones, which is why they were tested separately first. Sale price down 8 per cent, construction cost up 10 per cent, programme extended three months.
- GRV falls to $2,760,000.
- Non-land cost becomes $2,000,000 + $150,000 construction + $31,000 programme = $2,181,000.
- Land is held at the $600,000 already committed, so total development cost is $2,181,000 + $600,000 = $2,781,000.
- Profit is $2,760,000 − $2,781,000 = −$21,000, a margin on cost of about −0.76 per cent. The project has crossed zero.
That is worse than adding the isolated effects, for the correlation described earlier: the programme extension adds cost to a project that has already lost revenue, and the construction overrun adds to a cost base already stressed.
Break-even is where gross realisation equals total development cost and profit is zero. On this combined cost base, break-even GRV is $2,781,000, about 7.3 per cent below the base-case GRV of $3,000,000. Read it the other way and it is more useful: on this cost base the project can absorb a gross realisation fall of roughly 7 per cent before it runs out of profit. Below that the shortfall is funded by equity or the project does not proceed.
Restate the boundary here, where it is most tempting to cross it. The combined scenario was chosen to be severe. It is not the worst case, not the expected case and not a likely case. Nothing on this page attaches a probability to it, and a feasibility reporting it as more probable than the base case has invented a distribution it does not have.
What to Do With the Result
Rank the variables by how much they move the answer, and act on the ranking rather than on general unease. The variable that moves residual land value most is the one to attack, which points at four routes: renegotiate the land price to the stressed residual rather than the base residual; change the scheme to reduce exposure to the largest mover; buy certainty on the largest mover with a fixed-price contract, a rate hedge or a firmer programme; or decline the site.
One cross-check is worth borrowing from valuation practice. Compare the residual result against comparable land sales. If the model says the land is worth considerably more than comparable land is changing hands for, the model is making a claim about the market rather than reporting one.
Do not mistake any of this for due diligence. What the finished product sells for belongs to a registered valuer and a selling agent, what it costs to build belongs to a quantity surveyor or builder, whether approval is granted and on what conditions is not a modelling question, and what finance is available belongs to your broker and lender. A model that appears to have settled any of those has recorded someone's guess in a cell and carried it to the bottom of the page with authority it never had.
Frequently Asked Questions (FAQ)
What is sensitivity analysis in property development?
Re-running a feasibility with one assumption moved, to see how much movement it takes to change the decision. In practice you start from a base case, move sale price, construction cost, interest rate and programme one at a time, then combine them. It is scenario testing, not probability forecasting.
Is sensitivity analysis the same as a probability forecast?
No, and the difference is the presence of a probability distribution for each input. A deterministic model produces an output for a chosen input and assigns no likelihood to it. Where a distribution is missing, the analyst either uses a method that does not need one or invents assumptions about it. This article uses the first approach, which is why no scenario here carries a chance of occurring.
How many scenarios should a feasibility test?
Enough to rank the variables and no more. The test for whether an assumption belongs on the list is whether moving it can change the decision. Building a large grid where most inputs barely move the answer tends to hide the one or two assumptions that matter.
What is break-even in a development feasibility?
The point where gross realisation equals total development cost and profit is zero. On the combined cost base in the worked example, break-even gross realisation is $2,781,000, about 7.3 per cent below the base case. Break-even is scenario-specific, because it depends on the cost base the scenario produced.
Why does delay matter more in cash flow than in profit?
Because it extends the period the facility is drawn while pushing settlements further out at the same time. That raises peak debt and delays its repayment. On the profit line a three-month delay is the smallest of the four scenarios tested here; on the cash-flow line it is often the largest problem.
Should I use ±8 per cent for sale price?
There is no single correct interval, and the right one is the interval large enough to change the decision on the specific project. Cyberate PM, a DDDI Group related entity, discloses that its model tests sale price at ±8 per cent alongside 40+ cost line items. That is one firm's disclosed modelling convention, not a market forecast or an industry standard, and it should not be read as a prediction about prices.
Where This Leaves the Decision
The method is three steps and one instruction. Build a base case. Isolate each variable so you can rank them. Combine them, because they interact. Then read the cash-flow line as well as the profit line, because a project that clears one test can fail the other.
The scenarios bound the decision. They do not predict the outcome, and a feasibility presenting them as a prediction has overreached the tool.
Cyberate PM, part of the DDDI Group, runs property development feasibility studies for South Australian landowners and small developers, with a defined risk and sensitivity testing stage covering construction cost escalation, interest rates, sales prices and programme delay. Cyberate PM is a DDDI Group related entity and this is a service referral rather than an independent third-party recommendation.
For the wider process this analysis sits inside, start with the pillar on property development feasibility.