
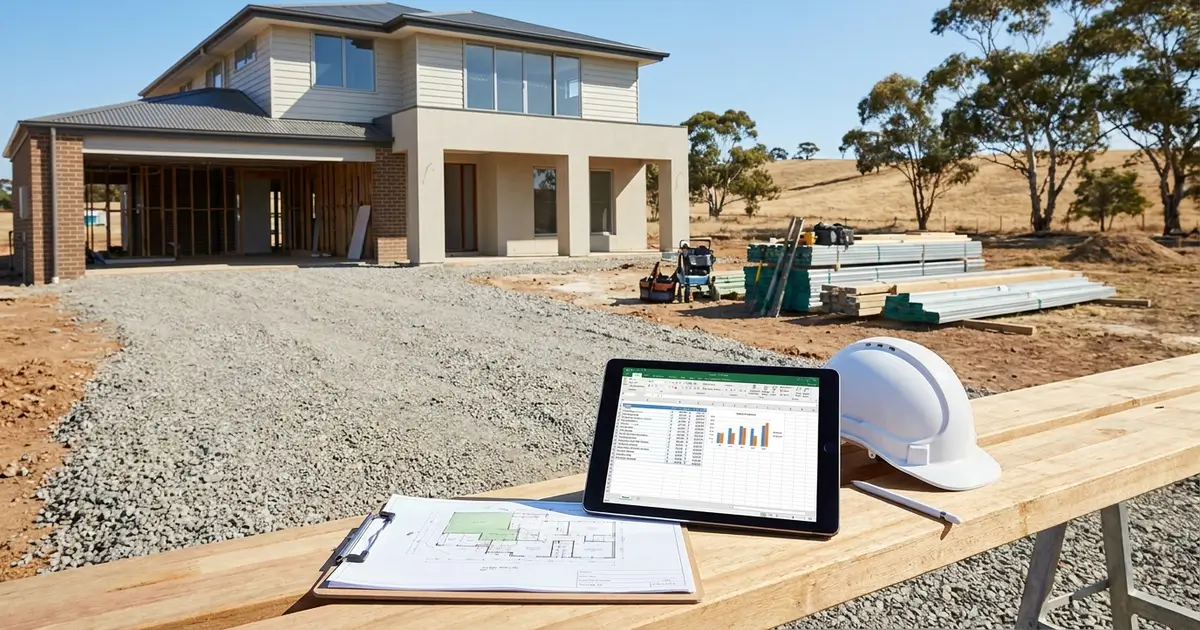
This page publishes a free property development feasibility template in Excel, with six sheets, 51 cost line items and live formulas, plus the walkthrough you need to make it mean something. Download the workbook — direct link, no form, no email gate. There is no form because this site is a static publication with no delivery pipeline behind it, and a gate that leads nowhere would be worse than no gate at all.
Read this before you open it, because it governs every number inside. The workbook is a filled example, not a blank formula template. Every dollar figure in it is an invented illustrative assumption chosen so the arithmetic is easy to follow. None of it is a quote, a valuation, a current fee schedule or a prediction about any real project. What is real is the structure and the formulas: you can watch them reconcile before you change a single cell.
The workbook does not calculate transfer duty, land tax or GST, and it contains no monthly cash flow, so it cannot show peak debt. Both limits are explained below rather than buried.
Key takeaways
- The workbook is a filled, editable example with live Excel formulas, not a template of empty cells.
- Every figure in it is an invented illustrative assumption. None is a quote, valuation, fee schedule or forecast.
- It deliberately excludes transfer duty, land tax and GST, because all three move with the land price — which is why a real residual land value needs iteration rather than subtraction.
- It has no monthly cash flow, so it cannot show peak debt. A project can pass the profit test and still fail the funding test.
- The structure is the deliverable. Replace the Assumptions drivers, replace each Costs basis line with a quote, QS estimate or official schedule, then read the Summary and stress the Sensitivity sheet.
Workbook structure at a glance
| Sheet | What it holds | What you edit |
|---|---|---|
| Instructions | Read-first page: how to use it, what it does not do, conventions | Nothing |
| Assumptions | Eight driver cells, shaded as the intended inputs | The drivers |
| Revenue | Unit-by-unit sale prices and floor areas, summing to gross realisation | Unit mix and prices |
| Costs | 51 line items in five groups, each with a basis and a cash-outflow month range | Every line |
| Summary | GRV less non-land cost less target profit, then TDC, profit and both margins | The price you would pay |
| Sensitivity | Seven scenarios, and the new land value each one implies | Nothing |
The design point that makes the file worth trusting is the wiring between sheets. Summary and Sensitivity read Assumptions, Revenue and Costs by cell reference, so no figure is retyped and no total is typed by hand. Change a driver and the answer moves with it.
If you are still deciding whether a workbook is the right instrument at all, the method behind it is set out in our guide to running a property development feasibility.
Assumptions: the only place you should type
Eight drivers, all in one block, all shaded. These are the workbook's defaults, not recommendations.
| Driver | Default | Unit | What it drives |
|---|---|---|---|
| Dwellings to be built | 3 | count | Revenue and construction cost |
| Average sale price per dwelling | $1,000,000 | A$ excl GST | Gross realisation |
| Base construction cost per dwelling | $500,000 | A$ excl GST | Construction lines |
| Target profit | $400,000 | A$ | The residual |
| Programme length | 18 | months | Finance and holding |
| Average drawn debt balance | $1,400,000 | A$ | Interest |
| Annual interest rate | 9.00 | % p.a. | Interest |
| Monthly holding cost | $4,000 | A$ / month | Holding |
Two of these rows carry a note worth reading in the file. Target profit reads "What the risk is worth to you — a decision, not a market fact." That is the honest framing: a residual is only as meaningful as the return you insisted on, so a target profit lifted from someone else's project imports their risk appetite rather than reflecting yours. The average drawn debt row reads "Read off a monthly cashflow, not guessed" — and that instruction points outside this file, because the workbook does not contain that cash flow. Whatever you enter there is what the interest scenario inherits. The denominators behind the margin outputs are covered in our guide to margin on cost.
Revenue
Five fields per unit: unit, type, floor area in square metres, sale price GST-exclusive, and a basis column. The default is three townhouses at 145 m² and $1,000,000 each, with gross realisation calculated as =SUM(D5:D7) — $3,000,000.
The basis column is a field, not a caption. It is where you record what each price is evidenced by, and the workbook's own default value is "Comparable sales within 3 months" — the difference between a comparable sale and an agent's appraisal. The sheet also carries a reminder that belongs in any model: an approved scheme and a concept can price very differently, and a concept still carries design, approval and timing risk that has to be reflected somewhere.
Costs: 51 lines in five groups
Every cost row has five fields: group, line item, basis or evidence to use, amount, and cash outflow month range.
| Group | Lines | Total (A$) |
|---|---|---|
| Construction | 21 | 1,500,000 |
| Professional fees | 10 | 120,000 |
| Statutory fees and contributions | 8 | 80,000 |
| Finance and holding | 8 | 150,000 |
| Sales and marketing | 4 | 150,000 |
| Total non-land development cost | 51 | 2,000,000 |
The construction group runs from demolition and site clearance through to structural framing, services, joinery, landscaping and a crossover, and carries contingency as its own line rather than as a percentage buried elsewhere. Professional fees cover the architect or building designer, structural, civil and hydraulic engineers, geotechnical work, energy assessment, the certifier, the planner, a quantity surveyor and the surveyor. Statutory fees hold the development application fee, building consent, council contributions, water and sewer connections, energy connections, tree approvals and permits. Finance and holding carries establishment costs, interest on drawn debt, line fees, council rates, land tax during holding, insurance, site security and reporting. Sales and marketing covers agent commission, advertising, styling and photography, and sales legals.
The basis column is the argument of the sheet. Every row states what evidence is supposed to replace it — a builder quote, a QS allowance, a fee proposal, a council fee schedule, an SA Water charge, a RevenueSA assessment, a facility letter, an agency agreement. The cash-outflow column gives each row a month range. That records when cash leaves, which is what you need to see timing risk; it is not a monthly cash-flow statement, and the workbook does not turn it into one. The full cost register, with who supplies each number and when the cash leaves, is in our guide to property development costs.
Note what is absent. Land is not a cost line here. It is the residual on the Summary sheet, because the amount the land can carry is the output of this calculation rather than an input to it. That distinction is the whole idea behind residual land value.
Summary: reading the answer
The upper block is the residual calculation. Gross realisation =Revenue!D9 of $3,000,000, less non-land development cost $2,000,000, less target profit $400,000, gives a residual land value of $600,000.
The lower block does something different: it tests a price instead of deriving a ceiling. Enter the land price you expect to pay — $600,000 by default — and the sheet returns total development cost =Costs!D66+B10 of $2,600,000, development profit of $400,000, margin on cost of 15.38% and margin on revenue of 13.33%.
Reconcile it in one line: $2,000,000 + $600,000 = $2,600,000; $3,000,000 − $2,600,000 = $400,000; and 400,000 / 2,600,000 = 15.38%. Every figure agrees, which is the point of publishing a filled example rather than a blank one.
The same project shows a higher margin on cost than on revenue, and the workbook says so on the sheet: a 15 per cent result and a 13 per cent result can describe one identical project. Always state the denominator. If you pay more than the residual, the profit falls below the target you set — which is the entire reason to calculate it before making an offer.
One caution that belongs here. The subtraction above is a simplified form, not a general exact solution. Transfer duty, land-related interest and margin scheme GST can each depend on the land price, so a full model has to iterate rather than subtract. The mechanism is set out in the residual land value derivation.
Sensitivity: seven scenarios
The sheet re-runs the model seven ways — base case, sale price 8 per cent lower and 8 per cent higher, construction cost 10 per cent higher, interest rate 2 points higher, programme 3 months longer, and a combined downside.
A sale price 8 per cent lower moves gross realisation to $2,760,000, profit to $160,000, margin on cost to 6.15% and the residual to $360,000. A 10 per cent construction overrun adds $150,000, taking profit to $250,000, margin to 9.09% and the residual to $450,000.
Two columns are easy to misread. The profit column holds your land price fixed, so you can see what each shock does to the return you actually get. The new-residual column recalculates what the land could carry if you insisted on the original target profit — the price you would need to renegotiate to. The workbook states its own caveat on the sheet, and it is worth repeating: this is a stress test, not a forecast. It shows what the project can absorb; it attaches no probability to any row. The method for choosing what to test and in what order sits in our guide to feasibility sensitivity analysis.
How to use it
- Replace the shaded driver cells on Assumptions with your own figures. Start with unit count and sale price, because revenue moves the outcome more than any single cost line.
- Confirm the Revenue sheet's unit rows match the Assumptions unit count, and that the gross realisation sum still covers every row. That is the one place a structural error is likely if you add dwellings.
- Replace every Costs basis with real evidence: builder quotes, a quantity surveyor's estimate, consultant fee proposals, and the relevant council and authority fee schedules for the specific site. A line whose basis still reads as the workbook's placeholder text is not yet a cost.
- After editing, confirm the five group subtotals still sum to the total. A row inserted outside a sum range is the most common silent failure in any cost build-up.
- Read Summary. If the price you would actually pay exceeds the residual, the profit sits below your target — treat that as a price problem rather than a margin problem.
- Stress the Sensitivity sheet, then check cash-flow timing separately, because the sheet tests scenarios and not months.
The wider value of a workbook like this is comparison. Keep the assumptions identical across two or three sites and the structure tells you which one carries the better risk-adjusted return, which is a more useful output than any single number.
What the workbook does not do
It does not calculate transfer duty, land tax or GST. All three depend on the price, the entity and the transaction structure, and they change the answer. In South Australia, "all transfers of residential and primary production land are subject to duty on the instrument of transfer based on the value of the land (including improvements) or the consideration (including GST) whichever is greater" (RevenueSA, page dated 17 November 2025). That makes the duty figure a function of the price you are still solving for. Under the GST margin scheme's consideration method, "the margin is the difference between the property's selling price and the original purchase price" (ATO, page last updated 19 August 2021), so the GST amount moves with land price as well. That interdependence is exactly why a real residual land value requires iteration or Goal Seek rather than the subtraction shown here. The margin scheme is also a tax calculation rather than a measure of development profit.
It does not model a monthly cash flow, so it cannot show peak debt. The month ranges on the Costs sheet are a timing field, not a cash-flow statement. Peak debt is the most a facility is ever drawn at one point, and on many projects it lands near the end of construction in the weeks before the first settlements. A project can show a profit on the Summary sheet and still fail because the peak balance exceeds what a lender will advance. If your project is more than a straightforward infill, our guide to small-site development feasibility sets out what a fuller model has to carry.
It does not test the planning envelope. It does not check zoning, overlays, minimum lot size or what will actually be approved. It prices a scheme you already believe is approvable.
It does not replace professional advice. It is not a quantity surveyor's estimate, an accountant's tax position, a lender's credit decision or a licensed valuer's opinion. Cost estimating and feasibility work sits within the AIQS competency standards for quantity surveyors, alongside "estimating, cost planning, cost management ... feasibility studies and asset financial management" (AIQS). The construction line is an allowance until a QS or a tender replaces it, and the statutory rows are placeholders until the current official schedule is applied for the specific site. Nothing here is financial, tax or legal advice, and nothing here is a valuation.
Free workbook or paid software?
A spreadsheet is the right instrument for a one-off calculation or a site or two a quarter. Popurise, which publishes the argument and also sells feasibility software, puts the boundary this way: Excel is "yes, for a one-off bespoke calculation or a single project a quarter", while "for a recurring workflow with several feasibilities a month, structured software pays back inside a month" (Popurise, May 2026). Weigh the incentive as well as the argument. The comparison itself belongs in our review of property development feasibility software in Australia.
This workbook is built to avoid three of the failure modes that audits find most often: no figure is retyped across sheets, there is no circular interest reference, and every cost row carries its required evidence in a column. The failure mode it does not avoid is the one that matters most on timing — single-period figures understate peak debt, and this file has no monthly model at all.
Frequently asked questions
Is this template free, and do I have to give you my email address?
Free, and no. The link on this page points directly at the file. There is no form because this publication is a static export with no email delivery process implemented, and promising one would be a promise the site cannot keep.
Is the workbook blank or filled in?
Filled in. Every formula is live and every figure is a labelled assumption, which means you can read the arithmetic working before you change anything. The numbers themselves are invented to make that arithmetic easy to follow.
Can I use it for a project outside South Australia?
The structure travels; the statutory rows do not. Council contributions, connection charges, application fees and land tax are labelled to South Australian authorities and have to be replaced with the current schedule for the relevant jurisdiction and the specific site. The cost checklist covers what each row should be replaced with.
Does the workbook calculate stamp duty?
No, deliberately. Transfer duty depends on the price paid for the land, which is the figure the model is solving for. Calculating it inside a subtraction would give you an answer that is wrong in a way you cannot see.
Does it show peak debt?
No. There is no monthly cash flow in the file, so peak debt cannot be read from it. That is the single most important reason not to rely on the Summary sheet alone.
Will it open in Google Sheets?
Yes. It is a standard .xlsx file with live formulas and no macros, and it recalculates on open in Excel, Google Sheets and LibreOffice.
Can I trust the numbers in it?
No, and they are not offered to be trusted. They exist so the relationships between revenue, cost, profit and margin can be seen working. Replace them with your own evidence before the file informs any decision.
Running the model for a real site
The workbook gives you the structure. Running it against a specific parcel, with current South Australian rates, a checked planning envelope and a monthly cash flow that shows peak debt, is a different piece of work. Cyberate PM, part of the DDDI Group, builds the model that way for a named site through its development feasibility service. Cyberate PM is a DDDI Group related entity, so this is a related-party referral rather than an independent third-party recommendation. Want a professional team to run the model for your site?